Driving Biological Project: Gene Networks in Cancer
Driving Biological Project:Gene networks in cancer: an example of a GenomeSpace analysis. Detailed descriptions of the datasets used, and the analysis steps taken, to examine gene regulatory networks (GRN) in human cancer stem cells through GenomeSpace. Videos illustrating the analysis can be found on the GenomeSpace YouTube channel, as the "Driving Biological Project: Identifying Gene Regulatory Networks in Human Cancer Stem Cells" playlist.
Legend:
provided datasets: located in the GenomeSpace SharedData account, under the folder: Driving Biological Projects → Identifying Gene Regulatory Networks in Human Cancer Stem Cells
derived datasets: files that are generated during the analysis
analysis steps
GenomeSpace tool used in analysis step
Module, subtool or plugin used in analysis step
Menu → indicates menu items or navigation through a tool's menu
parameter used in analysis step
Definitions:
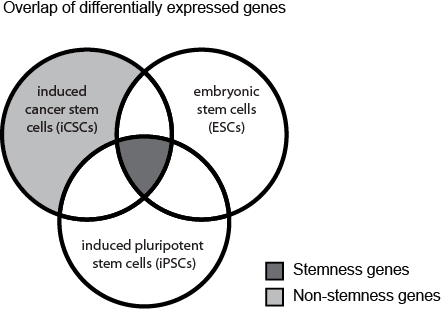
Stemness signature: a set of genes which are upregulated in induced cancer stem cells (iCSCs), and enriched in embryonic stem cells (ESCs) and induced pluripotent stem cells (iPSCs). These genes represent a stem cell state.
Non-stemness signature: a set of genes which are upregulated in iCSCs, but are not associated with the stemness signature.
Stemness "ON": a set of breast cancer tumor samples which have significant enrichment in the stemness signature.
Stemness "OFF": a set of breast cancer tumor samples which do not have enrichment of the stemness signature.
Dataset Descriptions:
Dataset 1: Microarray gene expression data of induced cancer stem cells (iCSCs), generated from primary human keratinocytes which were transformed into squamous cell carcinomas using Ras, IκBα, and either GFP, E2F3, or c-Myc1. Provided files:MYC_E2F3GFP.gct, MYC_E2F3GFP.cls
Dataset 2: Microarray gene expression data of embryonic stem cells (ESCs) and induced pluripotent stem cells (iPSCs) created from subsets of several published datasets (Gene Expression Omnibus accession numbers: GSE224992, GSE222463, GSE123904, and GSE151485). Provided files:diff_ESCiPSC.zip, diff_ESCiPSC.array.tab
Dataset 3: Data of primary human breast cancer tumor samples including gene expression data (GCT format, calculate from Affymetrix .CEL files), CNV data (aCGH format), and reference annotation data6. Provided files:breasttumor.geneexp.gct, breasttumor.acgh.txt
Dataset 4: Array comparative genomic hybridization (aCGH) data of primary human breast tumor samples6. Provided files:breasttumor.acgh.order.cn
Dataset 5: ChIP-seq data of identifying targets of the human c-MYC transcription factor7. Provided files:SRR502406.fastq.gz
Gene sets (Published or Custom): These can be manually curated custom gene sets of the investigator's choice, or previously published gene sets (e.g. from MSigDB or Reactome). Example gene sets used in this analysis include stem cell expression signatures, human cancer modules, ChIP-seq targets, genes altered by RNAi, Gene Ontology terms, and KEGG pathways.
Analysis Steps:
1. Examine gene expression differences between induced cancer stem cells (iCSCs) and parental cells or non-tumorigenic transformants.
3. Determine whether the genes up-regulated in iCSCs (from #1) share any similarity with genes expressed in ESCs or iPSCs (from #2).
Input: list of iCSC-associated genes (#1; up_regulated_in_MYC_over_E2F3GFP.slice.gct); other gene expression datasets (#2; diff_ESCiPSC.preprocessed.collapsed.tab); an accompanying array description file (diff_ESCiPSC.array.tab).
Identify stemness genes: First, identify how many iCSC-associated up-regulated genes (#1) are enriched in the ESC and iPSC datasets (#2), using the ModuleMap tool in Genomica. Stemness genes are genes common to all the stem cell-based datasets.
Launch Genomica on the gene expression file (#2) from GenomeSpace.
Navigate to the menu Sets → Load Gene Sets from GenomeSpace File... Then choose the gene set file (#1).
Navigate to the menu Sets → Load Experiment Sets from GenomeSpace... Then choose the experiment file (diff_ESCiPSC.array.tab).
Navigate to the menu Algorithms → Create a Module Map...
Under Gene Sets, click the box next to ...up_regulated_in_MYC_over_E2F3GFP.slice.gct
Under Gene Sets, set Exclude gene sets with more than to 10000
Under Experiments, set Expression levels >= __ are considered up-regulated to 0.5
Under Experiments, set Expression levels <= __ are considered down-regulated to -0.5
Under Experiment attributes, check the box next to ...diff_ESCiPSC.array
Run the analysis to create a module map.
Obtain a list of stemness genes:
In the window Exp.An, highlight the Gene column.
Click the View Gene Hits button.
Click Analyze.
Once the new heatmap is loaded, under Print Analysis, click Columns. Save the resulting file of Gene Symbols and annotations to your local computer. Give the file a name, e.g. stemness.lst.
Save this file to GenomeSpace.
In GenomeSpace, convert the LST file to a Genomica geneset TAB format:
Right-click on the file, then choose Convert
Convert to: geneset.tab
Click Convert on Server
Identify non-stemness genes: Next, identify how many of the iCSC-associated up-regulated genes (#1) are enriched in the differentiated cells. First, identify which are up-regulated in iCSCs (#1), but are not present in the stemness signature (#3A.vi), using the IntersectingIdentifiers module in GenePattern. Next, use the ModuleMap tool in Genomica to create a module map to identify non-stemness genes. Non-stemness genes are unique to iCSCs.
Identify non-stemness genes up-regulated in iCSCs (IntersectingIdentifiers, GenePattern).
Launch GenePattern from GenomeSpace.
Using the IntersectingIdentifiers module, change the following parameters:
First file:stemness.geneset.tab
Second file:up_regulated_in_MYC_over_E2F3GFP.slice.gct
First file identifier column index: 1
Second file identifier column index: 1
Output file name prefix: stemness_MYC
First file skip rows: 1
Second file skip rows: 0
Click Run to run the job.
From the output files, save the stemness_MYC.notinfirst.gct file back to GenomeSpace, then convert the GCT to a Genomica geneset tab format:
Right-click on the file, then choose Convert
Convert to: geneset.tab
Click Convert on Server
Use Genomica to identify non-stemness genes using the ModuleMap tool.
Launch Genomica on the gene expression file (#2).
Navigate to the menu Sets → Load Gene Sets from GenomeSpace File..., choose the stemness_MYC.notinfirst.geneset.tab file (#3B.i).
Navigate to the menu Sets → Load Experiment Sets from GenomeSpace.... Then choose the experiment file (diff_ESCiPSC.array.tab).
Navigate to the menu Algorithms → Create a Module Map...
Under Gene Sets, click the box next to ...stemness_MYC.notinfirst.gct
Use the same parameters as in #3A.iv.
Run the analysis to create a module map.
Obtain a list of non-stemness genes:
Follow the steps in #3A.v to save the file, e.g. nonstemness.lst.
Follow the steps in #3A.vi to convert the file to nonstemness.geneset.tab.
Visualize the results of #3A and #3B in Genomica.
Output: a list of 550 stemness genes (stemness.geneset.tab) and a list of 469 non-stemness genes (nonstemness.geneset.tab). NOTE: Do not close Genomica.
4. Determine if the stemness genes (#3A) are systematically regulated at a transcriptional level during differentiation.
Input: list of stemness genes (#3A; stemness.geneset.tab); gene sets of interest. In this example, we evaluate the MSigDB gene set for computationally derived human cancer gene expression (Collection 4), and the MSigDB Gene Ontology gene set (Collection 5).
First, upload collections of gene sets of human cancer gene expression and the Molecular Signatures Database (MSigDB) (http://www.msigdb.org) to GenomeSpace.
Download the following gene sets to your local drive:
c4.cm.v4.0.symbols.gmt
c5.all.v4.0.symbols.gmt
Save all files to GenomeSpace.
Convert all files to Genomica TAB format:
Right-click on the file, then choose Convert
Convert to: geneset.tab
Click Convert on Server
Next, perform a multidimensional gene set enrichment analysis of the stemness gene list (#3A) against the gene sets from MSigDB using the Analyze Gene Sets tool in Genomica.
In Genomica, navigate to the menu Sets → Load Gene Sets from GenomeSpace File.... Then choose the stemness gene set (#3A).
Navigate to the menu Sets → Load Gene Sets from GenomeSpace File.... Then choose a gene set to compare, e.g. C4 Cancer Module gene set (#4A.i, c4.cm.v4.0.symbols.geneset.tab).
Navigate to the menu Analyze → Gene Sets....
Under Sets to Analyze, choose the "stemness" gene set.
Under Sets to Find Enrichment For, choose a gene set (e.g. C4).
Click Analyze to run the analysis.
OPTIONAL: save the results, e.g. stemness_GO.gxp.
Repeat the analysis with the other gene sets as well. NOTE: to repeat the analysis using other gene sets, you may have to reload Genomica to clear the memory of previous gene sets. Make sure to include an expression array dataset when reloading.
Obtain and visualize expression profiles of any enriched gene sets of interest (Genomica).
Output: a list of 50 cancer modules and 101 Gene Ontology terms that are enriched in stemness genes (P-value < 0.01, hypergeometric test, FDR < 0.05).
5. Determine if the non-stemness genes (#3B) are systematically regulated at the transcriptional level during differentiation, by repeating #4A-4C on the non-stemness genes.
Input: list of non-stemness genes (#3B; nonstemness.geneset.tab); gene sets of interest. In this example, we evaluate the MSigDB gene set for computationally derived human cancer gene expression (Collection 4), and the MSigDB Gene Ontology gene set (Collection 5).
Perform a multidimensional gene set enrichment analysis of the non-stemness gene list (#3B) against the gene sets from MSigDB using the Analyze Gene Sets tool in Genomica.
In Genomica, navigate to the menu Sets → Load Gene Sets from GenomeSpace File.... Then choose the non-stemness gene set (#3B).
Navigate to the menu Analyze → Gene Sets....
Under Sets to Analyze, choose the "non-stemness" gene set.
Under Sets to Find Enrichment For, choose a gene set (e.g. C4).
Click Analyze to run the analysis.
OPTIONAL: save the results, e.g. nonstemness_GO.gxp.
Repeat the analysis with the other gene sets as well.
Obtain and visualize expression profiles of any enriched gene sets of interest (Genomica).
Output: a list of 37 cancer modules and 11 Gene Ontology terms that are enriched in non-stemness genes (P-value < 0.01, hypergeometric test, FDR < 0.05).
6. Determine how the stemness and non-stemness gene signatures are represented in differentiated cancer cells. To determine this, first process and normalize breast cancer gene expression profiles in GenePattern, for later analysis in Genomica.
Input: A breast cancer gene expression dataset (breasttumor.geneexp.gct)
Send the resulting file from #6E (e.g. breasttumor.geneexp.preprocessed.collapsed.cdt) back to GenomeSpace.
Convert the CDT file from #6F to a Genomica TAB file:
Right-click on the file, then choose Convert
Convert to: genomicatab
Click Convert on Server
Output: a normalized gene expression file of normal/tumor breast cancer samples in Genomica tab format (breasttumor.geneexp.preprocessed.collapsed.tab).
7. Determine the relationship between stemness genes and differentiated breast cancer tumor samples. To do this, separate the tumor samples into two groups based on whether they are enriched or depleted for expressed stemness genes. Then, use this categorization to process breast cancer tumor copy number variation (CNV) data.
Input: a normalized gene expression file of breast cancer samples (#6; breasttumor.geneexp.preprocessed.collapsed.tab), the list of stemness genes (#3A, stemness.geneset.tab), and the raw breast cancer CNV profiles (breasttumor.acgh.txt).
First, create a module map to distinguish the two groups of breast cancer tumor samples in Genomica.
Launch Genomica on the gene expression dataset file (#6; breasttumor.geneexp.preprocessed.collapsed.tab).
Navigate to the menu Sets → Load Gene Sets from GenomeSpace File.... Then choose the stemness gene set file (#3A; stemness.geneset.tab).
Navigate to the menu Algorithms → Create a Module Map...
Under Gene Sets, click the box next to ...stemness.geneset
Under Experiments, set Expression levels >= __ are considered up-regulated to 0.5
Under Experiments, set Expression levels <= __ are considered up-regulated to -0.5
Run the analysis to create a module map.
Next, create an experiment array set out of the arrays which are up- or down-regulated for stemness genes by processing the module map output in Genomica.
In the window Exp.An, highlight the column, e.g. "INGENESET".
Under Print Analysis, click Regulation. Choose a folder. Genomica will automatically create and save the following files to this folder: INGENESET.present.txt, INGENESET.absent.txt, and INGENESET.array.tab.
Save the files to GenomeSpace.
Next, normalize the raw breast cancer copy number variation (CNV) profiles (breasttumor.acgh.txt) using the Acgh2Tab module in GenePattern.
Launch GenePattern from GenomeSpace and search for the Acgh2Tab module, then run with the following parameters:
acgh input file:breasttumor.acgh.txt
presentlist file:INGENESET.present.txt
absentlist file:INGENESET.absent.txt
genelocs file: hg18_refseq_genes.txt
Click Run to run the job.
Save the converted aCGH file from #7D to GenomeSpace (e.g. acgh.avergene.tab).
Output: an experiment set file that separates breast cancer tumor samples based on presence (up-regulation) or absence (down-regulation) of stemness genes (INGENESET.array.tab), a normalized CNV profile (acgh.avergene.tab), arrays in which the stemness signature is present (INGENESET.present.txt; "Stemness ON" samples) and absent (INGENESET.absent.txt; "Stemness OFF" samples).
9. To identify if gene expression signatures (such as "Stemness ON" and "Stemness OFF") are associated with copy number aberrations in genes regulating transcription, perform Stepwise Linkage Analysis of Microarray Signatures (SLAMS).
Description of the SLAMS procedure11:
Sort tumor samples into groups based on whether the stemness signature is present ("ON") or absent ("OFF") (Completed in Step #7).
Compare the DNA copy number changes (from the array CGH data) between the groups of tumor samples. Calculate the association between stemness expression and CNV datasets to identify amplifications/deletions associated with the stemness signature.
Select genes which are potential candidate regulators of the stemness signature, based on coordinate gene amplification/deletion and gene expression upregulation/downregulation.
Validate the candidate regulators by assessing their predictive ability in independent samples of tumor samples.
Input: the normalized breast cancer CNV profiles (#7D; acgh.avergene.tab), the experiment array set with stemness present/absent annotation (#7B; INGENESET.array.tab), the processed MSigDB C1 collection (#8A; c1.all.v4.0.symbols.geneset.tab), and the normalized breast cancer gene expression dataset (#6; breasttumor.geneexp.preprocessed.collapsed.tab).
First, compare CNV data between groups of tumor samples to identify candidate regulators of expression, using Genomica.
Launch Genomica on the normalized breast cancer CNV profile (#7D).
Navigate to the menu Sets → Load Gene Sets from GenomeSpace File.... Then choose C1 collection of chromosome cytobands file from GenomeSpace. (#8A).
Navigate to the menu Sets → Load Experiment Sets from GenomeSpace File.... Then choose the experiment array set of samples that are present or absent for stemness genes (#7B).
Navigate to the menu Algorithms → Create a Module Map...
Under Gene Set, click the box next to ...c1.all.4.0.symbols.geneset
Under Experiment attributes, check the box next to ...INGENESET.array
Run the analysis to create a module map using default settings.
Next, save the list of most promising candidate regulators back to GenomeSpace, and converts the file format.
In the window Exp.An, highlight the "CHR8Q24" and "CHR8Q22" columns (the top 2 most enriched cytobands).
Click View Gene Hits.
Check the box next to ...INGENESET.array.
Click Analyze.
Once the new heatmap is loaded, under Print Analysis, click Columns. Save the resulting file of 145 candidate regulators, e.g. candidate_regulators.lst.
Upload candidate_regulators.lst to GenomeSpace.
In GenomeSpace, convert the LST file to a Genomica geneset TAB format:
Right-click on the file, then choose Convert
Convert to: geneset.tab
Click Convert on Server
Next, obtain a list of candidate stemness regulators based on coordinate gene amplification/deletion and gene expression upregulation/downregulation.
Upload the normalized breast cancer gene expression dataset breasttumor.geneexp.processed.collapsed.tab to Genomica (#6).
Navigate to the menu Sets → Load Gene Sets from GenomeSpace File.... Then choose the candidate regulators file (#9E; candidate_regulators.geneset.tab).
Navigate to the menu Sets → Load Experiment Sets from GenomeSpace File.... Then choose the experiment array set of samples that are present or absent for stemness genes (#7E).
Navigate to the menu Algorithms → Create a Module Map...
Under Gene Sets, click the box next to ...candidate_regulators.geneset
Under Experiment attributes, check the box next to ...INGENESET.array
Run the analysis to create a module map.
Finally, save the list of stemness regulators back to GenomeSpace, and convert the file format.
In the window Exp.An, highlight the "INGENESET" column.
Click View Gene Hits.
Check the box next to ...INGENESET.array.
Click Analyze.
Once the new heatmap is loaded, under Print Analysis, click Columns. Save the resulting file of 48 stemness regulators, e.g. stemness_regulators.lst.
Upload stemness_regulators.lst to GenomeSpace.
In GenomeSpace, convert the LST file to a Genomica geneset TAB format:
Right-click on the file, then choose Convert
Convert to: geneset.tab
Click Convert on Server
Output: visualize the enrichment of cytobands CHR8Q24, CHR8Q22 in the CNV data for tumors with the stemness signature. Obtain a list of identified regulators (e.g. stemness_regulators.geneset.tab). This file contains a list of 48 candidate regulators (out of the 145) that are "stemness regulators", which are also significantly enriched in "Stemness ON" tumors. One of these stemness regulators is MYC, suggesting that the iCSC model faithfully recapitulates genes reprogrammed in authentic human cancers by c-MYC amplification. Finally, visualize the expression of the breast cancer gene expression dataset for these regulators.
11. Having determined that some transcriptional regulators have copy number aberrations that affect gene expression in breast cancer tumor samples, check if specific transcription factors and miRNAs (such as Oct4, Nanog, Sox2, Myc and the Polycomb complex) are regulating stemness and non-stemness genes.
Input: ChIP-seqs of TFs and epigenetic regulators such as Myc (SRR502406.fastq.gz).
Upload the file to GenomeSpace (SRR502406.fastq.gz).
Load ChIP-seq data into the GalaxyChIPseq pipeline.
Send the SRR502406.fastq.gz file to Galaxy.
Click on the pen icon to change the file attributes. Change the following parameters:
Database/Build: Human Feb. 2009 (GRCh37/hg19) (hg19)
Datatype: fastqsanger
Click Save to save the changes.
Map the ChIP-seq reads using Bowtie. Navigate to the menu NGS: Mapping → Map with Bowtie for Illumina. Set the following parameters:
Will you select a reference genome from your history or use a built-in index?: Use a built-in index
Select a reference genome: Human (Homo sapiens) (b37): hg19 Canonical
Is this library mate-paired?: Single-end
FASTQ file:#11B.i (GenomeSpace importer on SRR502406.fastq.gz)
Bowtie settings to use: Full parameter list
Maximum permitted total of quality values at mismatched read positions (-e): 40
Number of mismatches for SOAP-like alignment policy (-v): 2
Suppress all alignments for a read if more than n reportable alignments exist (-m): 1
Click Execute to run the job.
Filter the results using SAM Tools. Navigate to the menu NGS Toolbox Beta → NGS: SAM Tools → Filter SAM. Set the following parameters:
Select dataset to filter:#11C (Map with Bowtie for Illumina on data 1)
Flags: insert flag
Type: The read is unmapped
Set the states for this flag: No
Click Execute to run the job.
Call peaks using the Model-based Analysis of ChIP-Seq (MACS) tool. Navigate to the menu NGS Toolbox Beta → NGS: Peak Calling → MACS. Set the following parameters:
ChIP-Seq Tag File:#11D (Filter SAM on data 2)
Select the regions with MFOLD high-confidence enrichment ratio against background to build model: 10
Click Execute to run the job.
Send the .bed file back to GenomeSpace. Navigate to the menu Send Data → GenomeSpace Exporter. Set the following parameters.
Send this dataset to GenomeSpace:#11E (MACS on data 3 (peaks: bed))
filename: SRR502406.bed
Click Execute to run the job.
Obtain a gene set of transcription factor target motifs and miRNA target motifs from MSigDB.
Download the following gene sets to your local drive:
c3.all.v4.0.symbols.gmt
Save all files to GenomeSpace.
Convert all files to Genomica TAB format:
Right-click on the file, then choose Convert
Convert to: geneset.tab
Click Convert on Server
Perform a multidimensional gene set enrichment analysis of the stemness gene list (#3A) against the gene sets from MSigDB using the Analyze Gene Sets tool in Genomica.
Launch Genomica on the normalized breast cancer gene expression dataset (#6; breasttumor.geneexp.preprocessed.collapsed.tab).
In Genomica, navigate to the menu Sets → Load Gene Sets from GenomeSpace File.... Then choose the stemness gene set (#3A).
Navigate to the menu Sets → Load Gene Sets from GenomeSpace File.... Then choose a gene set to compare, e.g. C3 motifs gene set (#11G, c3.all.v4.0.symbols.geneset.tab).
Navigate to the menu Analyze → Gene Sets...
Under Sets to Analyze, choose the "stemness" gene set.
Under Sets to Find Enrichment For, choose a gene set (e.g. C3).
Click Analyze to run the analysis.
OPTIONAL: save the results, e.g. stemness_motifs.gxp.
Output: a .bed file that can be visualized further.
13. Create a gene regulatory network of genes which regulate the transcriptional profile of stemness genes using the ModuleNetwork tool in Genomica.
Input: the normalized breast cancer gene expression dataset (#6; breasttumor.geneexp.preprocessed.collapsed.tab), the list of stemness regulators (#9J; stemness_regulators.geneset.tab).
Import the network results (#13A) from GenomeSpace into Cytoscape and show the gene regulatory network.
Launch Cytoscape from GenomeSpace.
Load the stemness network into Cytoscape:
Navigate to the menu File → Import → GenomeSpace → Load Network.... Choose the stemness network file (stemness_network.ndb).
Once the network is loaded, navigate to the menu Control Panel → Network.
Right-click on the stemness_network, and choose Create View.
Load the list of stemness regulators into Cytoscape:
Navigate to the menu File → Import → GenomeSpace → Load Attributes from Table.... Choose the stemness regulators file (stemness_regulators.geneset.tab).
Under the Advanced section, check the box next to Show Text File Import Options.
Under the Attribute Names section, check the box next to Transfer first line as attribute names.
Click Import to import the file.
Filter the network of nodes and edges to just the stemness regulators:
Under the Control Panel section, click the Filters tab.
Under the Filter Definition section, use the drop-down menu to choose node.INGENESET as the attribute to filter on.
Click Add to add the filter.
Under the Advanced section, double-click on the bar next to the INGENESET attribute, and change the following parameters:
Low bound: 1
High bound: 1
Click OK
In the main Cytoscape menu, click on the menu icon labeled, Create new network from selected nodes, all edges.
To better visualize the network, navigate to the menu Layout → Cytoscape Layouts → Degree Sorted Circle Layout.
Output: visualization of the gene regulatory network.
Non-stemness genes. Repeat steps 7, 9, 13 and 14 using the list of non-stemness genes, to identify genes regulating the non-stemness signature and to predict and visualize the iCSC unique regulatory network in Cytoscape.
 Click here for detailed, step-by-step instructions for this step.