Gitools
Project Website: http://www.gitools.org/
Gitools is a framework for analysis and visualization of genomic data using interactive heatmaps that also allows data to be imported from various sources, including Biomart, Ensembl, IntOGen, and GenomeSpace.
In the Gitools interactive heatmaps, every cell is associated with one or several values, and users can visualize them and navigate among them. Multiple annotation labels can be added to rows and columns. A number of actions can be performed within the heatmap that help to explore and interpret the data effectively, such as search, filter by value or label, cluster the heat-map, sort rows and columns by different criteria, and more. There are many editable features that make the heatmaps thoroughly customizable, such as color scales, size of cells, grid lines, font size, and color and type for labels.
It is possible to load multidimensional data genomic sets into the heatmaps. For example, a cell in a heatmap that represents a gene in a tumour sample can represent the expression level, mutation status, copy number alterations, and methylation changes. With these properties complemented by a set of analyses (such as correlations, overlaps, enrichment, or group comparison), the exploration of large multidimensional genomics datasets becomes very effective.
Importing Data From GenomeSpace
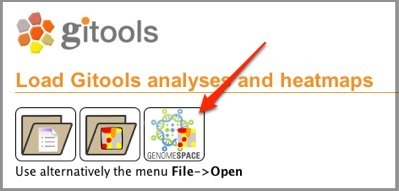
To open a data file from GenomeSpace, you can either click the GenomeSpace icon on the Gitools welcome page:
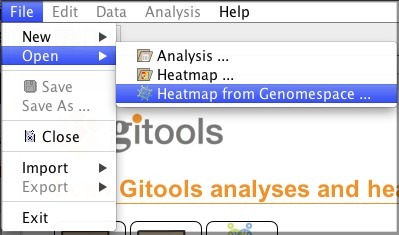
Or by selecting File>Open>Heatmap from Genomespace...
Learn how to send data from ArrayExpress to GiTools using GenomeSpace.
|
